
Rebecca Freese has worked as a data science intern for Metro Transit’s Strategic Initiatives Department since June 2016. She’s currently a graduate student at the University of Minnesota studying biostatistics. Freese wrote this post for the Rider's Almanac to share her experience with the important Strategic Initiatives projects she’s been working on and to entice others to apply to the Metro Transit internship program.
Growing up in a small town, public transportation wasn’t an option for me until I moved to Minneapolis to study mathematics in college. Without a car, I soon started to rely on buses and trains to get where I needed to be each day. With graduation approaching, I happened across an internship with Strategic Initiatives at Metro Transit, and the rest is history. Here’s a little more about the department and the projects I’ve worked on.
What is Strategic Initiatives?
Strategic Initiatives’ mission is to “improve the efficiency of transit operations and the customer experience with rigorous data analysis, research, and collaboration.” What that boils down to is we develop models, data visualization techniques, and provide analysis to help the agency make data-driven decisions.
Examples of this include forecasting ridership for a certain route for the next few months, investigating the effects of route and fare changes, and analyzing customer and employee surveys. We mainly use the statistical computing language software R, but occasionally branch into other languages, depending on project need. We’re a small group with a wide range of backgrounds, but we all have a common passion for our work.
What does a data science intern do?
During my time at Metro Transit, I’ve had the opportunity to work on a wide variety of projects. I’ve built an interactive mapping tool using R Shiny to visualize where bus accidents have occurred. Transit safety specialists can use this tool to determine if more training is needed on a particular stretch of road and to alert bus operators (drivers) about trickier locations.
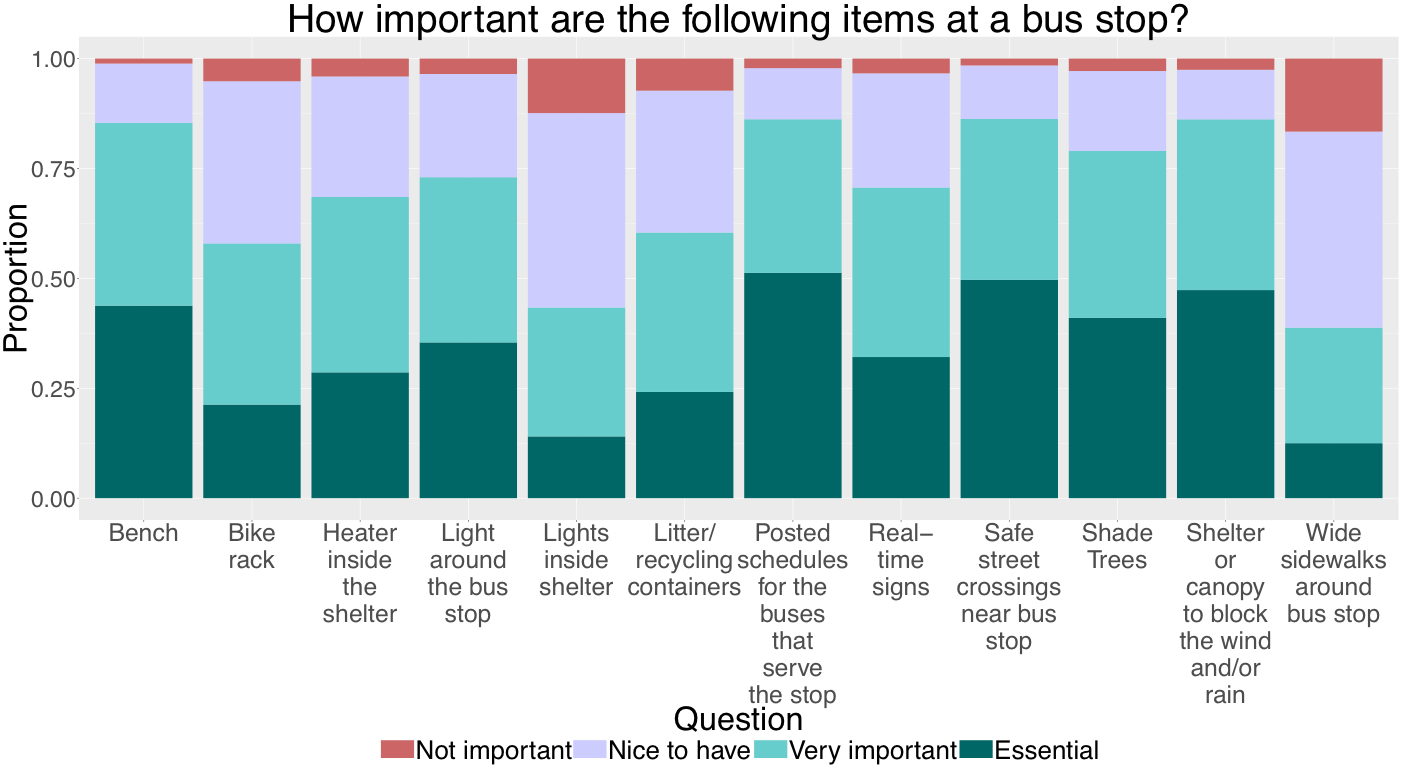
I’ve also analyzed survey data that asks Metro Transit customers what features are important to have at a bus stop, and where the agency should prioritize placing shelters. The plot below shows the how important participants felt each of the features were to have at a bus stop. The dark and light green colors represent the proportion of people who felt a particular feature was essential or very important, whereas the purple and red indicate the proportion of people who thought that feature was just nice to have or not important. We can see that the benches, posted schedules, safe street crossings, and shelters had the highest proportion of people indicating they were essential or very important. Lights inside the shelter and wide sidewalks were marked as not important most frequently.
Similar questions were asked about where people preferred to have bus shelters, and highly ranked locations included where many people wait for the bus and near hospitals, social service centers, and senior housing. This information was then used as the basis for updating guidelines for where Metro Transit places bus shelters and what features to include in them.
Bikes on the A Line (Rapid bus service)
A fun project I worked on during the summer of 2017 was visualizing when and where A Line customers tend to use the bike racks mounted on the front of the bus. Magnetic counters were installed on all A Line buses, so that when someone takes their bike on or off the bus, the time and location of the event is recorded. This data helps us better understand our multimodal customers, particularly, where they prefer to ride their bike and where they prefer to ride the bus. Maybe we should consider installing more secure bike lockers and tire pumps at stops where many bikers get on or off the bus? As more data are collected, we hope to be able to tell waiting customers if there’s an open spot for their bike on the next bus approaching.
Below is an interactive plot showing the stations along the A Line where customers used the bike racks on the bus, between April 1, 2017 and December 31, 2017. Locations where someone puts their bike on the bus are at the top of the plot, and where they get off is on the bottom. The thicker the ribbon between two locations, the more people have taken that trip. Hover above “origins” or “destinations” to get the option to sort the stations alphabetically or by how many people use the bike racks. You can also click and drag the name of a station to a new location for custom sorting. Additionally, hovering above a colored ribbon gives the percentage of people who ride the bus with their bike on each of the segments.
We can see that for southbound customers, people have ridden the A Line with their bike 570 times between Rosedale Transit Center and Snelling and University, which is 8% of the total trips. The majority of customers who put their bike on the bus at Snelling and University, heading south, ride to the 46th St Station.
Play around with sorting the stations by origin or destination and see what inferences you can make.
A Line plot for bike rack usage
I like this plot for a few reasons. One, because it’s kind of pretty (although the director of our department wishes he could run a hairbrush through it to untangle it), and two, it shows a lot of information quickly.
I will admit, it’s got a lot going on, but once you find an interesting pattern, you can dig deeper with other plots or models to investigate further. For example, why are the above-mentioned trips so popular? We could look into bike lanes in the area to see if that stretch of road is biker-friendly. It’s very likely that the areas where bikers prefer to ride the bus are along roads with heavy traffic or without marked bike lanes. Snelling and University is probably a popular station because of its proximity to the Green Line.
Would you like to be a data science intern for Metro Transit?
If you’ve made it this far, I have good news! My internship is coming to an end this spring, so we are in search of a data science enthusiast to take my place. This is not the kind of internship where you’re stuck going on coffee runs for the office or doing other mindless busywork. This is a hands-on environment to hone your skills while working with a supportive and dedicated team.
If any of what I mentioned above appeals to you, check out the positions available in Strategic Initiatives:
Performance Analyst
Data Scientist
Students interested in interning at Metro Transit are invited to submit applications through Sunday, Feb. 4. Applicants must be enrolled in a post-secondary education program or have graduated within the past year. Interns work full-time, from late May through the end of the summer. Some interns may also stay on in part-time roles through the school year. All interns are paid $18.50 an hour.
Internship positions are available in Strategic Initiatives, Marketing, Engineering & Facilities, Finance, Service Development and Rail Operations. There are also positions in the Green Line Extension and Blue Line Extension project offices and the other Council divisions.
Review openings and learn more at the Metropolitan Council's internships page.